| Introduction | Circular Functions | Authoring | Cartesian Connection |
In this activity you will create a function that involves a dilation followed by a translation, with both functions restricted to a number line. Instead of showing all the variables on the same line, you’ll throw in a twist (a turn, really) and put the dependent variable on a vertical number line while the independent variable remains on a horizontal line.
This trick will allow you to make a picture of the behavior of the function, and you will experiment with different scale factors and translation vectors to see how the shape of the picture relates to the behavior of the variables. As you master the skills, you’ll test yourself by matching “mystery functions” in order to become a Level 4 functionista.
As you work, remember that construction mistakes are good: mistakes are the things you learn from. (And you can always use Undo ![]() to go back after making a mistake.)
to go back after making a mistake.)
Paragraphs starting with Q contain questions for you to answer, as you work to analyze and understand your results. Your teacher will tell you where to record these answers. Download the answer form, or record your answers on your paper. You can also download this worksheet.
Construct
Begin by creating a dilate function on a horizontal number line.
Tap the Investigate button to go to page 2.
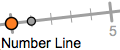
Then tap the Number Line tool to create the first number line. Tap the origin to make it permanent.
Drag the point at 1 on the number line to make it horizontal.
Tap the Dilate tool. Attach the center of dilation to the origin of the number line, and attach independent variable x to the number line. Tap the scale factor s to finish connecting the tool.
Vary x by dragging it back and forth on the number line. Observe the behavior of D(x).
How does D(x) behave as you vary x? How is the behavior affected if you change the scale factor to s = –0.5?
Next transfer variable D(x) to a vertical number line, and then translate it vertically.
Change the scale factor to 1.50.
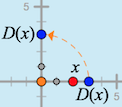
Tap the Number Line tool again, and attach the new number line to the origin of the first number line. Rotate the new number line to make it vertical.
Tap the Transfer tool. Attach the glowing point to D(x).
What do you notice now when you vary the independent variable? How does the transferred value on the vertical number line compare to the values of the points on the horizontal number line?
What transformation did the Transfer tool use? How does this transformation keep the value the same?
Tap the Translate tool. Attach the tail of the vector (the orange point) to the origin, and attach the the translation function’s independent variable (the blue point) to the dilated blue point that you transferred to the vertical number line.
What do you notice now when you vary the independent variable? As you vary x along the horizontal axis, how do the points D(x) and T(D(x)) compare on the vertical axis? How do their measurements compare?
Now you’ll add lines to track the horizontal location of x and the vertical location of T(D(x)).
Use the x-value tool to construct a vertical line through x, and use the y-value tool to construct a horizontal line through T(D(x)).
What do you notice about these lines as you vary the independent variable?
Tap the Traced Intersection tool and use it to construct a point at the intersection of the lines.
Investigate
Vary x. What happens to the intersection, and what do you notice about its traces?
Change the translation vector by dragging point v, and then vary x again. How do the new traces compare to the old traces?
Try several different translation vectors. (Be sure to include v = 0 and several negative vectors.) To help analyze your results, draw a sketch showing several sets of traces for different values of v. Make a conjecture about how the value of v affects the traces, and test your conjecture by predicting the traces for a new value of v and then checking to see if your were right.
What stayed the same for all the traces for different values of v? What changed for different values of v?
How can you explain your conclusions based on the dilation and translation you used to construct T(D(x))?
Perform a similar investigation to figure out the effect of changing the scale factor s while you leave v unchanged. Draw a sketch showing the resulting traces, and make and test a conjecture to describe your conclusions.
What stayed the same for all the traces for different values of s? What changed for different values of s?
How can you explain your conclusions based on the dilation and translation you used to construct T(D(x))?
On Your Own
Use pages 3 and 4 to experiment. For instance, you could use the tools to construct several different functions on the same page to make it easy to compare them. Or you could use one page to construct the three functions Ds(x), Tv(x), and Tv(Ds(x)) to investigate how the individual functions Tv and Ds relate to the composed function Tv ∘ Ds.
The notation Tv ∘ Ds signifies “the translation by v of the dilation by s.” Thus “Tv ∘ Ds(x)” has the same meaning as “Tv(Ds(x)).”
On page 5, construct T(D(x)) as you did earlier. Then use the Mystery Function tool to create a mystery function. Your job is to study the behavior of the mystery function and change your values of s and v to exactly match the mystery function. On this page you can try a variety of mystery functions, think hard, and work your way up until you become Level 4 functionista. Describe what you discovered as you practiced.
Web Sketchpad Copyright ©2015 KCP Technologies, a McGraw-Hill Education Company. All rights reserved.