[This is an example of a page of an electronic textbook, powered by Web Sketchpad. The fundamental difference from traditional textbooks is that this
text contains interactive mathematics, mathematics that students can manipulate and even construct. Note that the figures below assume
that students are already familiar with using Web Sketchpad tools. If you are unfamiliar with using these tools, use the Video Tips button below.]
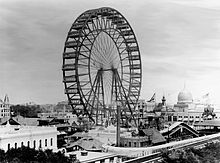
The original Ferris Wheel was built by George Washington Gale Ferris, Jr. in 1893 for the World's Columbian Exposition in Chicago. The wheel, 80 meters high and equipped with 36 passenger cars with 40 seats in each car, was the highlight of the Exposition.
In this lesson, you'll use an interactive model to investigate the mathematics of how you move when you're riding a Ferris Wheel. In the figure on the right, you can tap the button to stop or start the wheel, you can change the slider to change the wheel's speed, and you can even drag any of the passenger cars.
As the wheel turns, watch one of the cars, paying attention to the height of the car above the ground. How does the height depend on the rotation of the wheel?
Imagine that you are riding on a Ferris Wheel. The figure below shows only a single passenger car—the one you are riding in. Use the figure to investigate exactly how your height above the ground changes as the wheel turns.
Tap the Vertical Distance tool to measure the height h of your car. (A horizontal line is automatically attached to your car. You must attach the glowing point to the ground line and attach the glowing parameter to the existing scale measurement.)
Tap the Rotation Distance tool to measure the rotation distance d of the wheel. (Again, attach the glowing parameter to the scale measurement.)
Try out the Start Wheel button. (Experiment with the button to figure out how to reset the wheel.)
Tap the Graph Point tool to graph the height h as a function of the distance d.
(To graph more than a single revolution, you must reduce the scale and use the Start Wheel button to run the wheel.)
Use the Undo button if you need to undo a mistake.
Tap the Video Tips button beneath the websketch to watch a short movie demonstrating how the three tools work.
Fig. 3: Construct a graph to show how the height of the Ferris wheel changes as the wheel turns.
Check Yourself
With your group, decide which five of the questions below are most interesting. Press the button at the end of any question to type your answer. [Note: We've not yet decided on the technology to use for such answers, so only the first two questions have buttons at this time.]
How far does the car go in one revolution? How far does it go in three revolutions?
What are the minimum and maximum heights the car reaches as the wheel revolves?
Type here
How can you tell from the graph when the car is moving up and when it is moving down?
Is there a place on the graph where the car is not moving either up or down? Explain your answer.
How can you adjust the model so the graph shows three full revolutions of the wheel? How can you make it show five full revolutions?
Adjust the speed to the fastest setting, restart the wheel, and observe the spacing of the dots. What does the spacing tell you about the motion of the car?
If the graph goes beyond the right edge of the window, how can you still tell the number of revolutions the car has completed?
After your group has finished writing answers to at least five of these questions, discuss your observations, and your answers, with another group.
The Unit Circle
To analyze a mathematical problem, it's often helpful to create a simplified model, eliminating as many details as you can while keeping the mathematical situation intact. Use the Unit Circle figure below to construct a simplified version of the Ferris wheel, eliminating details to make the mathematics as simple as possible.
Tap the Unit Circle tool to make a unit circle to represent the wheel. Tap or drag the glowing point to make it permanent. (It's called a unit circle because its radius is 1 unit; we’re even keeping the numbers as simple as we can!)
Add an arc, attaching θ to your unit circle. The arc length is the rotation distance of point θ around the circle.
Measure the coordinates of point θ.
Graph the height of the point (y)as a function of the arc length (θ).
Fig. 4: Construct a graph to show how the vertical position of a point on the unit circle changes as the point moves around the circle.
Check Yourself
What details of the original problem have been dropped? What important elements have been retained?
What are the minimum and maximum heights that θ reaches as it rotates?
How can you tell from the graph when θ is moving up and when it is moving down?
Where on the graph is the height changing most quickly? Where is it changing most slowly?
What happens when θ does more than a single revolution?
How can you tell the number of revolutions θ has completed?
After your group has finished writing answers to at least five of these questions, discuss your observations, and your answers, with another group.
Problems
(Each problem button displays a websketch and tools you can use to work on the problem.)
Graph the horizontal location (x-value) of θ as a function of the rotation distance.
Graph the ratio of the y and x values (y/x) as a function of the rotation distance.
Projects
Graph From Scratch: Using stand-along dynamic software such as The Geometer's Sketchpad, start with a blank screen and create the same unit circle graph that you did in this lesson: the graph of the height of point θ as a function of the length of the arc. (You'll likely need to consult the software's documentation to determine how to accomplish various steps along the way.)
Multiple Rotations: Once you've completed project 1, figure out a way to make the graph extend beyond a single rotation about the unit circle. (In other words, the graph should extend beyond 2π.)
Length of Seasons: Research the efforts made by the ancient astronomers to figure out why summer is longer than winter. How did their mathematical work relate to the functions that you graphed in this lesson?
Commentary
Web Sketchpad has the potential to completely change the way that students experience mathematics textbooks. Instead of a passive experience reading a lesson in the book and then trying to do problems at the end of the lesson, students interact with the mathematics.
In addition to the dynamic nature of the figures, this example contains several other notable elements:
The example begins with a real-world example (figure 1, the picture of the very first Ferris wheel) and immediately presents students with a simplified model of a Ferris wheel (fig. 2), with motion that's completely under the control of the student.
In figure 3 students construct, manipulate, and observe their own model, and analyze it by graphing variables right there in the figure.
After students finish constructing the graph in figure 3, there are built-in online questions for formative assessment and for class discussion.
Figure 4 eliminates more detail and expresses the situation in the abstract form of a unit circle, thus getting to the mathematical heart of circular motion. This process of moving from the concrete to the abstract is explicitly described in the lesson.
The figures provide exactly the tools students need to create the mathematical elements themselves, with no unnecessary tools and no menus at all. This field of promoted action enables students to do the construction with a minimum of hand-holding by the teacher, allowing them a level of independence and self-direction that's hard to arrange in a more complex environment.
The four figures follow a sequence of progressive abstraction, paring away details from the real-life phenomenon to get to the heart of the mathematics. (This process, referred to as concreteness fading or as progressive abstraction, has been shown to be an effective strategy for developing students' abstract mathematical concepts.)
Problems can be presented using a short statement of a task along with a button to display the websketch within which students can do their work. Once the websketch is displayed, students can either submit their answer or cancel their work, to resume another time.
The open-ended Project suggestions don't involve use of WSP in its current form, though one can imagine a form in which students can go to a web site on which they either choose or even design the tools they want to appear in a sketch.
[Note that the Submit buttons, in this proof of concept web page, don't actually save the work. Web Sketchpad includes the required interface to save the state of a sketch, but this site doesn't yet include a database to support either websketch storage or tracking of users' work. It's easy to imagine a sophisticated system that provides the teacher a tablet on which she can view both up-to-date images of students' sketch work and the answers to the “Check Yourself” questions to guide her as she circulates about the room and as she moderates a class discussion.]
Limitations: This document is a proof of concept, not a finished lesson. The contents are examples only, and there are no assessment materials or teacher notes at all.